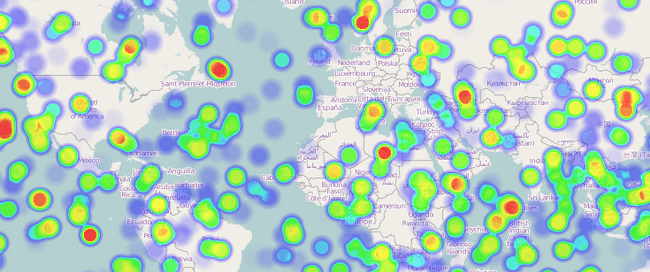
A heatmaps layer for OpenLayers
09 June, 2011 - 3 min read
As I commented on a previous post I know about heatmaps.js project some time ago and interest me a lot by its possibilities with OpenLayers. Of course it is not the only solution, see here and here but it has a great performance.
Some 'auto-bombo'
I put the creation of an OpenLayers layer in my maybe/something task list but seems the moment never arrives. Luckily for all of us, Patrick the author of the project, created too an initial heatmaps layer for OpenLayers and Google Maps.
The heatmap-openlayer code is a wrapper around the heatmap.js code and the initial version has some issues I have tried to improve. In concrete I have added:
- Heatmaps as independent map layer. On the initial version the heatmap-layer depends on another layer to make some position to pixel transformations.
- Points based on OpenLayers.LonLat. Now you can specify the points in any coordinate system and layer transforms it to the one used by the map.
- Possibility to pass the data set in layer constructor in addition to the method 'setDataset'.
- Improved 'addDataPoint' method to add new lonlat based points.
[caption id="attachment_304" align="aligncenter" width="588" caption="Click for the demo"]
 [/caption]
How to use heatmap-openlayers
The first step is to create the data set. The important things to remember about a dataset are:
- A dataset is an object with two attributes: a 'max' value used to colorize the points and an array with the data.
- Every point in the data array has two parts: an OpenLayers.LonLat object and an integer indicating the value.
Next code generate a random set of points:
// Generate some random data for test
var testData = {
	max: 50,
	data: []
};
var lon, lat, c;
for(var i=0; i<500; i++) {
	lon = Math.floor(Math.random()*(-180-180)+180);
	lat = Math.floor(Math.random()*(-85-85)+85);
	c = Math.floor(Math.random()*50);
	testData.data.push({lonlat: new OpenLayers.LonLat(lon, lat), count: c});
}
Now we can create our layer indicating its projection (the projection in which points are expressed) and necessary to transform points to map projection:
heatmap = new OpenLayers.Layer.Heatmap("Heatmap Layer", map, testData,
{visible: true, radius: 15},
{isBaseLayer: false, opacity: 0.3, projection: new OpenLayers.Projection("EPSG:4326")});
If you don't want to pass the dataset in the constructor simply pass a null value and set it later with the 'setDataset' method.
Finally, you can add more points later using the 'addDataPoint' method:
// Add more points
for(var i=0; i<100; i++) {
	lon = Math.floor(Math.random()*(-180-180)+180);
	lat = Math.floor(Math.random()*(-85-85)+85);
	c = Math.floor(Math.random()*50);
	heatmap.addDataPoint(new OpenLayers.LonLat(lon, lat), c);
}
Conclusions
This is only a little step to create a good layer for OpenLayers based on a nice and good performance project.
Much more work can be done so if you want to contribute simply get the from github and start working.